Home/Insights/Device market shareJan, 2025 - Oct, 2025
United States

Device market share

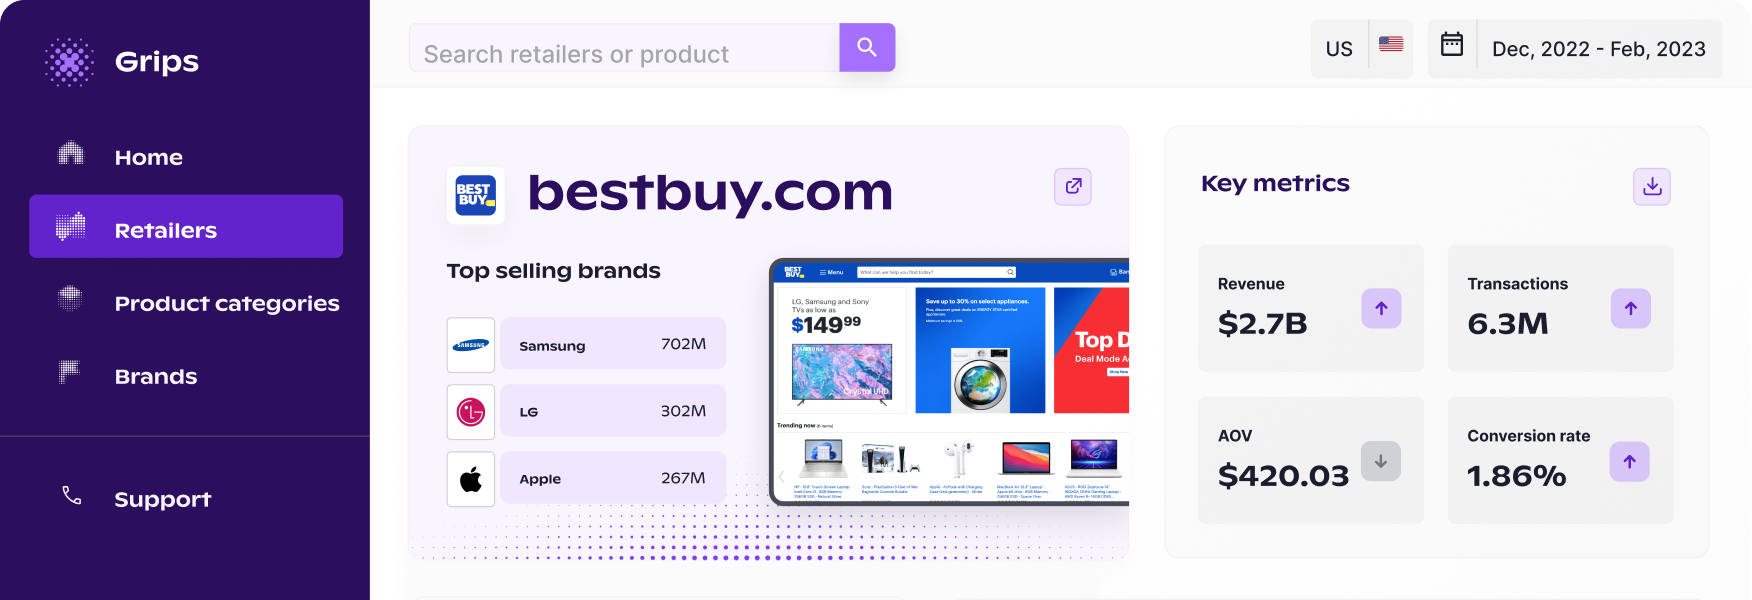
This report analyzes traffic from different devices on e-commerce sites. Grips Intelligence is dedicated to providing unparalleled insights into the ever-evolving landscape of e-commerce. With our cutting-edge technology and vast data repository, we offer in-depth analyses and benchmarks for the most sought-after metrics.

Device market share

Traffic share by devices

The share of traffic by devices

65%
Mobile
33%
Desktop
2.2%
Tablet

Sessions share over time by devices

Share of sessions in % from Jan, 2025 to Oct, 2025
Mobile
Desktop
Tablet

Gain a 360 view of your competitors and identify opportunities with Grips

Sign in with Google
Spot sales opportunities

Conversion rate by devices

The conversion rate by devices

2.9%
Desktop
2%
Tablet
1.9%
Mobile

Conversion rate over time by devices

Conversion rate from Jan, 2025 to Oct, 2025
Desktop
Tablet
Mobile

Average order value by devices

The average order value by devices

$170
Desktop
$122
Tablet
$117
Mobile

Average order value by devices

Absolute values in $ from Jan, 2025 to Oct, 2025
Desktop
Tablet
Mobile


Transform competitive
insights & industry trends into growth

Sign in with Google
Grips App Footer Image
© Grips 2022 All Rights Reserved